Long-form / 深度專題

颱風:由甲戌風災到氣候適應

Typhoons: from the Jiaxu disaster to climate adaptation

香港嘅颱風史,點解唔止係「幾號風球」?

1874 年甲戌風災之後,香港起避風塘、設天文台;1962 年溫黛令吐露港潮位升至 5.03 米;2018 年山竹再令維港錄得 3.88 米。每一次災難都改寫預警、工程與城市規劃,但下一場風仍然會找到新的脆弱點。

約 4 分鐘 · 6 節 · 25 條時間線 · 4 份文獻

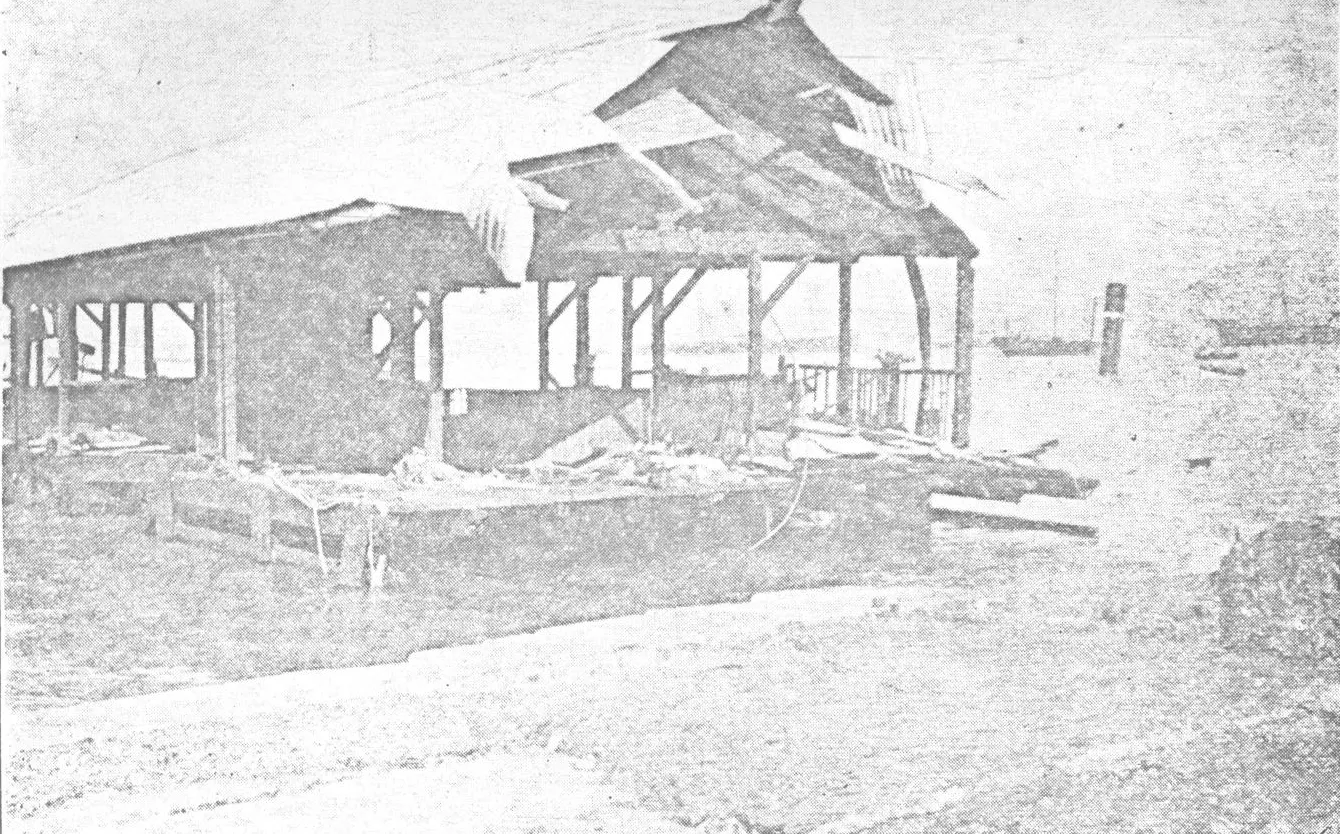
黑白照片:岸邊一個木構碼頭嘅上蓋被吹塌、支架外露,前方係草地同一片淺色空地,遠處海面有幾艘船;畫面整體曝光極淡、反差低。
1906 年 9 月 18 日颱風過後,九龍海旁渡輪碼頭嘅上蓋被吹塌。The roof of the ferry pier on the Kowloon waterfront collapsed after the typhoon of 18 September 1906.照片出自 1906 年香港《Hongkong Daily Press》出版嘅《The Calamitous typhoon at Hongkong, 18th September, 1906》(Commons 記錄)。Commons 檔名寫「Kowloon Stay Ferry」,站方未逐字核實係否指天星碼頭,所以圖說只寫「九龍海旁渡輪碼頭」。Commons 標示為公共領域。 · 《Hongkong Daily Press》1906 年颱風紀念冊照片,經 Wikimedia Commons 取得 · Public domain Commons 檔案頁 sha1 f5be066c21f2…

繁體中文

一、1874:一場風災催生制度

1874 年 9 月 22 日,甲戌颱風正面吹襲香港。志錄一處記逾二千人死亡,另一處記「數以千計」,兩個講法範圍唔完全一致,本篇並列而不相加。可以確定嘅係,風暴潮與巨浪重創港島沿岸設施,水上人社群受創最深;事後東華醫院撿拾遺體安葬,亦說明死亡規模超出正常處理能力。

呢場災難嘅長期後果,比死亡數字更值得追。志錄明言,甲戌風災推動避風塘興建同天文台成立。1883 年 3 月 2 日,香港天文台正式設立,職能包括氣象與地磁觀測、報時同熱帶氣旋警告;同年 5 月,銅鑼灣首個避風塘落成,防波堤全長約 426 米。由「事後救濟」轉向「事前避風、即時警告」,係香港城市治理嘅一個分水嶺。

二、1883–1937:儀器、信號與最致命的一場

1900 年 11 月,香港被颱風正面侵襲。天文台以鳴放風槍示警,災難造成二百餘人死亡,十艘蒸汽艇同一百一十艘帆船沉沒;因為十一月罕有颱風,所以叫「庚子風災」。呢個個案說明,早期預警嘅對象主要係海上船隻,而市區嘅危險亦唔只來自風,而係來自泊岸、繫泊同避風設施是否足夠。

1937 年 9 月 2 日,丁丑風災直接吹襲香港。風暴潮令吐露港海水倒灌,沙田與大埔大片土地被淹沒,約 11,000 人罹難,係香港有紀錄以來死亡人數最高嘅風災;大埔滘錄得 6.25 米最高潮位,維港則為 4.05 米。呢場災難之後,港府停止以燃放炸藥方式發出風暴警告,警告方式走向更制度化嘅信號系統。

三、1962 溫黛:風暴潮成為預警對象

1962 年 9 月 1 日,颱風溫黛吹襲香港,天文台發出十號颶風信號並持續八個鐘頭。當日早上六時十五分掛起十號信號,六時三十分另外發布風暴潮提示,說明維港水位會比平常漲潮高出六呎以上。呢個細節很重要:警告唔再只講風力,而係開始講水位。

溫黛造成 130 人死亡、53 人下落不明,受影響人數超過 46,000;大埔滘錄得 5.03 米最高潮位,維港 3.96 米。沙田係重災區,數條村落被淹沒。由 1937 年到 1962 年,警告系統由信號擴展到風暴潮提示,但城市仍然將大量人口同村落放在低窪地帶——工程與預警改善,唔等於土地用途風險自動消失。

四、1971–1983:十號信號、海上損失與城市韌性

1971 年 8 月 16 日,颱風露絲吹襲香港,十號颶風信號持續接近六個鐘頭。露絲帶來山泥傾瀉,全港有 110 處道路無法通行,另有 35 處低窪及近岸地帶水浸。呢個數字組合說明,十號信號唔只是一個風力標籤:它同時代表交通中斷、斜坡失穩同低窪地區受浸。

1983 年 9 月 9 日,颱風愛倫令天文台發出十號信號,歷時八小時;同月,355 艘小型船隻沉沒或受損,船舶破壞情況比露絲與溫黛更嚴重。由 1960 年代到 1980 年代,香港嘅樓宇同排水系統逐步改善,但海上作業、漁船同小型船隻仍然承受最大風險。防災唔可以只看市區,亦要看港口與海岸作業。

五、2008–2018:記錄不斷被改寫

2008 年 9 月,颱風黑格比令維港錄得 3.53 米最高潮位。2017 年 8 月,超強颱風天鴿吹襲,造成至少 129 人受傷;維港最高潮位 3.57 米,天文台聯同保險業聯會推算直接經濟損失約 12 億元。2018 年 9 月,山竹以超強級別侵襲,458 人受傷,維港潮位升至 3.88 米,吐露港風暴潮 3.40 米,直接經濟損失約 46 億元。

呢三個個案嘅共同點,唔只是「愈來愈強」,而係暴露城市系統嘅互相依賴:地庫停車場、玻璃幕牆、電力供應、鐵路與主要幹道,任何一環失效都會放大災情。2018 年山竹令維港及吐露港風暴潮增水創下天文台 1954 年設立儀器以來最高紀錄;記錄被打破,唔代表下一次一定更強,但代表現有設計標準需要重新檢視。

六、本篇的界線:天災、氣候與責任

本篇只講已登記條目支持嘅風災、警告與損失,唔會把單一颱風直接歸因於氣候變化,亦唔會假裝有能力預測下一場風。海平面上升、城市熱島、排水標準、斜坡安全、保險與停工安排,各自有唔同嘅官方資料來源;呢啲題目要做,就要另開專題,逐項核實。

同樣,天文台嘅警告系統、應急部門嘅疏散安排、醫院同電力公司嘅後備方案,都唔係一篇通史可以講完。寫得深,係指把「災難—制度—下一次災難」嘅鏈條講清楚,並且如實標明邊一段仍然未有資料。讀者如果只記得一個十號風球,咁本篇就失敗;如果記得城市每次都用新制度回應舊缺口,咁就達到目的。

未解與缺口

  • 海平面上升、城市熱島同氣候變化歸因未在本篇展開。
  • 排水標準、斜坡安全、樓宇抗風設計同保險安排未逐項核實。
  • 停工停課、疏散同應急部門協調嘅實際運作未收錄。
  • 漁船、貨櫃碼頭同機場嘅具體損失與復原時間未逐項查核。
  • 天文台警告系統嘅歷次改制細節,只點到與風災直接相關嘅部分。

文獻點讀

  • 《香港志·總述 大事記》(公元前 5000 年至 2017 年,共 6,500 多條大事)p.34、p.166、p.187、p.233、p.327、p.372、p.448風災、天文台、避風塘、十號信號同經濟損失嘅日期與原文數字。官方/出版者網址
  • 《香港志·自然》自然環境p.709天鴿、山竹嘅受傷人數、風暴潮同直接經濟損失。官方/出版者網址
  • 《香港志·自然》建置與地區概況(人口)p.331、p.350、p.536甲戌風災死亡、維港潮位排名同山竹增水紀錄。官方/出版者網址
  • 香港天文台的歷史網頁(無書頁)天文台成立背景、預警職能與歷史沿革。官方/出版者網址

頁碼係電子書頁碼;同一本書不同版次可能移位。引用時請連書名、卷冊同頁碼一齊寫。

English

1. 1874: a storm that produced institutions

On 22 September 1874 the Jiaxu typhoon struck Hong Kong head-on. One record gives over 2,000 deaths, another says thousands; the scopes do not match exactly, and this dossier lists them without adding them together. What is certain is that storm surge and heavy seas devastated the northern shore, with the boat population suffering most; Tung Wah Hospital later recovered bodies for burial, a sign that deaths overwhelmed normal arrangements.

The long-term consequence matters more than the toll. The record states that the Jiaxu disaster prompted both typhoon shelters and the observatory. On 2 March 1883 the Hong Kong Observatory was formally established, with duties covering meteorology, geomagnetism, time signalling and tropical cyclone warnings. In May that year the first typhoon shelter opened in Causeway Bay, its breakwater about 426 metres long. The shift from relief after the event to shelter and warning before it was a watershed in how the city was governed.

2. 1883–1937: instruments, signals and the deadliest storm

In November 1900 a typhoon struck Hong Kong head-on. The Observatory warned by firing typhoon guns; over 200 people died and ten steam launches and 110 sailing vessels sank. Because a November typhoon was rare, it became known as the Gengzi disaster. The case shows that early warnings were aimed mainly at vessels, and that danger in the city came not only from wind but from whether moorings and shelter were adequate.

On 2 September 1937 the Dingchou typhoon hit Hong Kong directly. Storm surge pushed seawater back into Tolo Harbour and flooded large parts of Sha Tin and Tai Po; about 11,000 people died, the highest death toll of any recorded typhoon in Hong Kong. Tai Po Kau recorded a maximum tide of 6.25 metres and Victoria Harbour 4.05 metres. After the disaster the Government stopped warning by firing explosives, moving towards a more institutionalised signal system.

3. 1962 Wanda: storm surge becomes the warning target

On 1 September 1962 Typhoon Wanda struck Hong Kong and the Observatory issued the No. 10 hurricane signal for eight hours. The signal went up at 6:15 am, and at 6:30 am a separate storm-surge warning stated that Victoria Harbour would rise more than six feet above normal high tide. That detail matters: warnings were no longer only about wind, but about water level.

Wanda killed 130 people and left 53 missing, affecting over 46,000. Tai Po Kau recorded a maximum tide of 5.03 metres and Victoria Harbour 3.96 metres. Sha Tin was among the worst-hit areas, with several villages submerged. Between 1937 and 1962 warnings had expanded from signals to storm-surge advice, yet the city still placed large populations and villages on low-lying land. Better engineering and warnings do not automatically remove land-use risk.

4. 1971–1983: No. 10 signals, marine losses and urban resilience

On 16 August 1971 Typhoon Rose struck Hong Kong and the No. 10 signal lasted nearly six hours. Rose brought landslides: 110 roads became impassable and 35 low-lying or coastal locations flooded. The combination shows that a No. 10 signal is not only a wind label; it stands for severed transport, unstable slopes and inundated low ground.

On 9 September 1983 Typhoon Ellen led the Observatory to issue the No. 10 signal for eight hours. That month 355 small vessels sank or were damaged, worse than under Rose or Wanda. From the 1960s to the 1980s buildings and drainage improved, but work at sea, fishing boats and small craft remained the most exposed. Disaster prevention cannot look only at the urban core; it must also look at the harbour and coastal work.

5. 2008–2018: records keep being broken

In September 2008 Typhoon Hagupit produced a maximum tide of 3.53 metres in Victoria Harbour. In August 2017 Super Typhoon Hato injured at least 129 people; the harbour reached 3.57 metres, and the Observatory with the insurance federation estimated direct economic losses at about HK$1.2 billion. In September 2018 Super Typhoon Mangkhut injured 458 people, raised the harbour to 3.88 metres and Tolo Harbour’s storm surge to 3.40 metres, with direct losses estimated at about HK$4.6 billion.

What these cases share is not simply “stronger storms” but the interdependence of urban systems: basement car parks, glass walls, power supply, rail and main roads. Failure in any one amplifies the rest. Mangkhut set the highest storm-surge increase in Victoria Harbour and Tolo Harbour since the Observatory’s instruments were established in 1954. A broken record does not prove the next storm will be stronger, but it does mean existing design standards need re-examination.

6. The limits of this dossier: hazards, climate and responsibility

This dossier covers only the storms, warnings and losses supported by registered entries. It does not attribute any single typhoon directly to climate change, nor pretend to predict the next one. Sea-level rise, the urban heat island, drainage standards, slope safety, insurance and stoppage arrangements each have their own official sources; they need separate dossiers and item-by-item verification.

Likewise, the Observatory’s warning system, emergency evacuation, hospital and power-company contingency plans cannot be exhausted in one essay. Depth means making the chain from disaster to institution to the next disaster clear, and marking honestly where evidence stops. If a reader remembers only a No. 10 signal, this dossier has failed; if they remember that the city answered each old gap with a new institution, it has done its job.

Gaps

  • Sea-level rise, the urban heat island and climate-change attribution are not developed.
  • Drainage standards, slope safety, wind-resistant building design and insurance arrangements are not checked item by item.
  • The practical operation of stoppage, evacuation and emergency coordination is not covered.
  • Specific losses and recovery times for fishing vessels, container terminals and the airport are not verified.
  • Changes to the Observatory’s warning system are mentioned only where directly tied to a disaster.

相關頁

引用本篇:請連標題、網址同「香港紀事館深度專題」一齊寫;時間線內每條條目仍以原書頁碼為準。

↑